Flight Delay Prediction Lab Guide (Microsoft Fabric)
This guide provides step-by-step instructions on using Copilot and other AI tools within Microsoft Fabric to build an end-to-end flight delay prediction solution. Visitors can follow these instructions to learn how to effectively leverage AI capabilities in Microsoft Fabric.
Repository: fabric-flight-ai-demo
Step 0: Create Workspace
First, you need to create a Microsoft Fabric workspace:
- Navigate to workspaces and click “New workspace”:
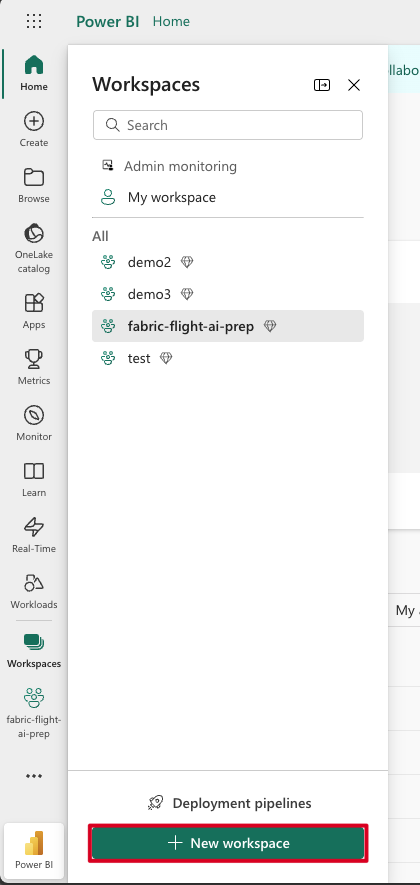
- Go to Microsoft Fabric homepage
- Click on Workspaces in the left navigation
- Click + New workspace at the bottom
- Fill in workspace details:
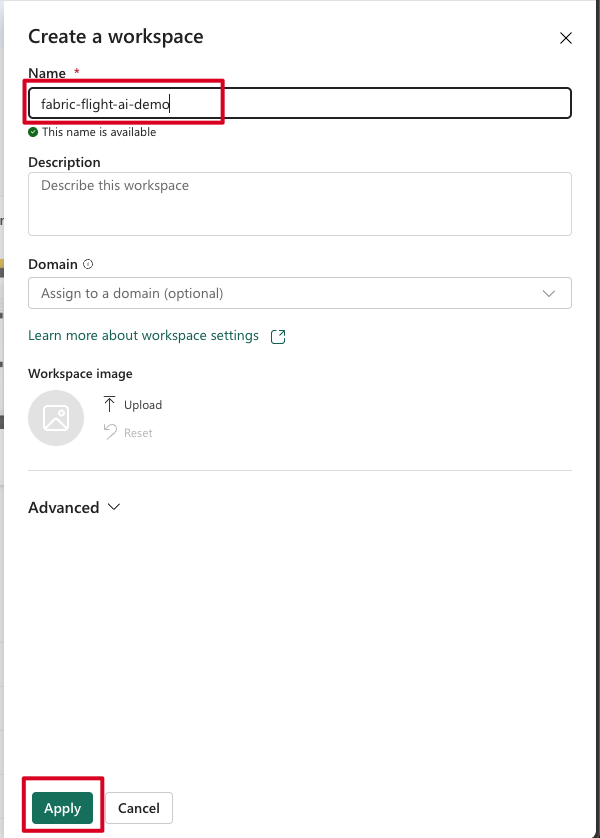
- Name it:
fabric-flight-ai-demo(or your preferred name) - Add description: “Flight delay prediction demo using Microsoft Fabric AI tools”
- Click Apply
- Create Lakehouse:
Step 1: Select Lakehouse from New Item
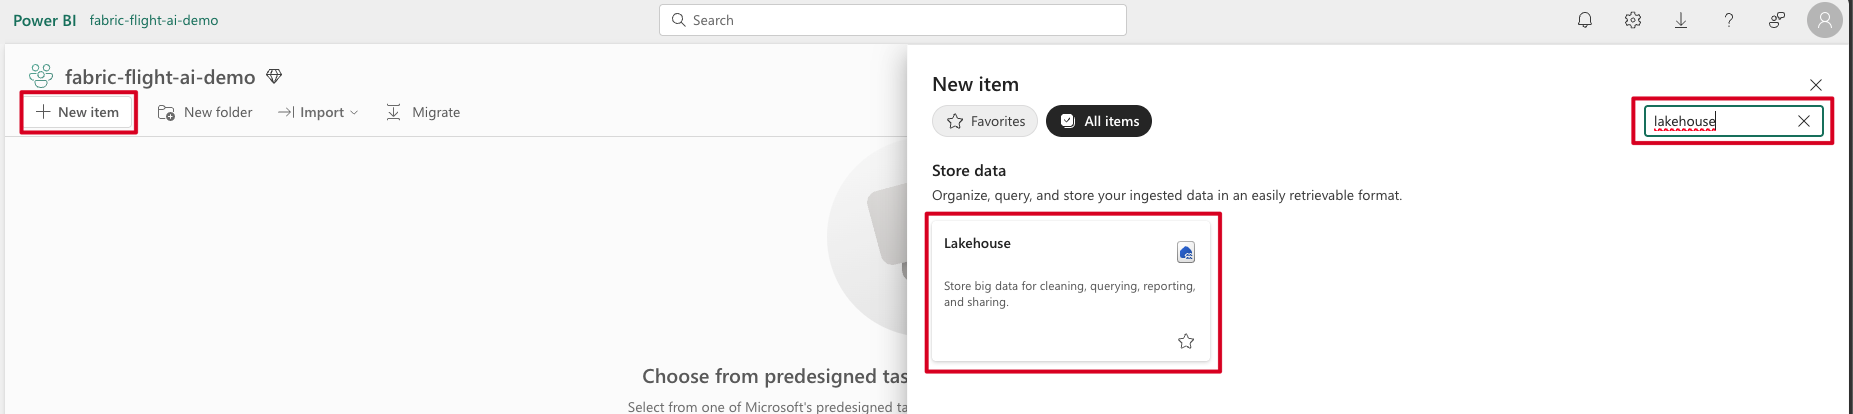
- In your new workspace, click + New item
- Search for “lakehouse” and select Lakehouse
Step 2: Name the Lakehouse
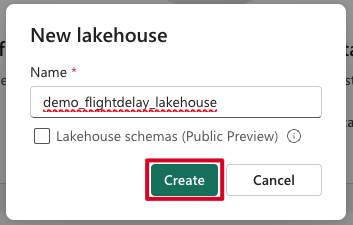
- Name it following naming convention:
<prefix>_flightdelay_lakehouse(e.g.,demo_flightdelay_lakehouse) - Note: Names can only include numbers, letters, and underscore (_)
- Click Create
Step 1: Upload CSV to Lakehouse
- Download the dataset from Kaggle: Flight Delay and Cancellation Dataset (2019–2023)
Step 1: Navigate to Files and Upload
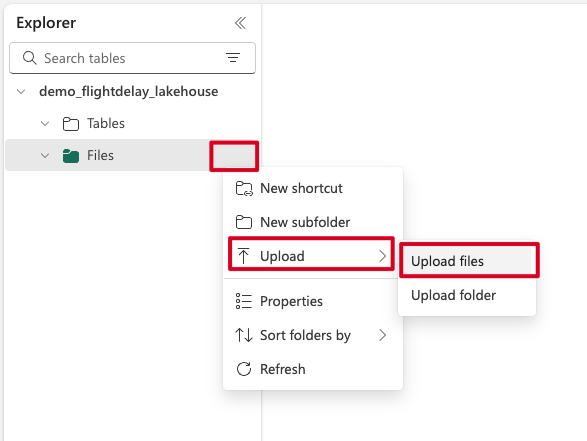
- Go to your Lakehouse > Files
- Right-click on Files or use the menu
- Select Upload > Upload files
Step 2: Upload the CSV File
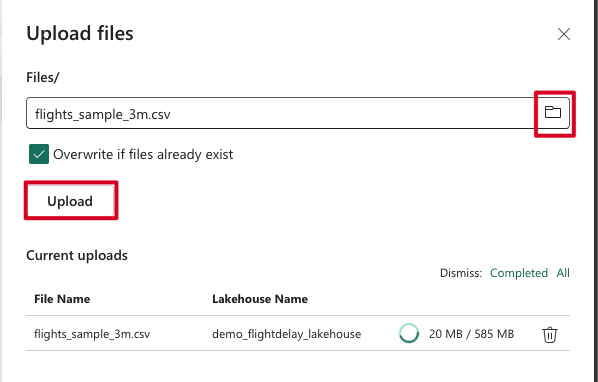
- Select or drag the
flights_sample_3m.csvfile - Check “Overwrite if files already exist” if needed
- Click Upload
Step 2: Dataflow Gen 2 – Clean & Transform
Note: This step can be skipped. You can now convert CSV files directly to tables using the Load to Tables functionality. Simply right-click on the uploaded file in your Lakehouse and select Load to Tables > New table.
Create Dataflow:
Step 1: Create New Dataflow Gen2
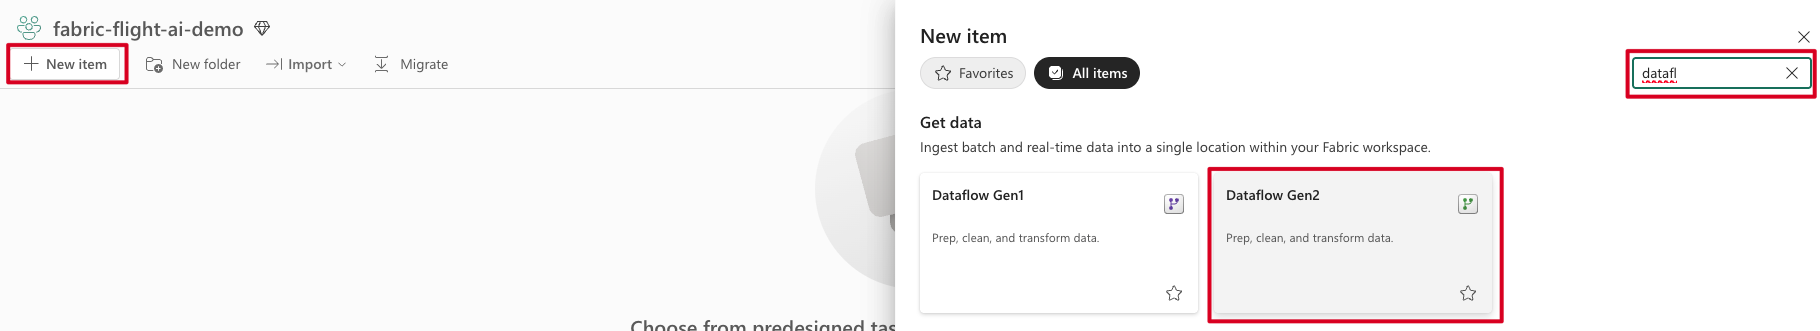
- Go to workspace > + New item
- Search for “datafl” and select Dataflow Gen2
Step 2: Rename the Dataflow
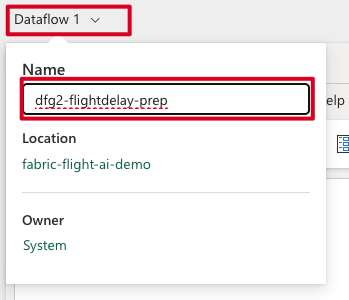
- Name it:
dfg2_flightdelay_prep(using underscores per naming convention)
Step-by-step using Copilot:
- Get data from Lakehouse file:
Step 1: Get Data from Lakehouse
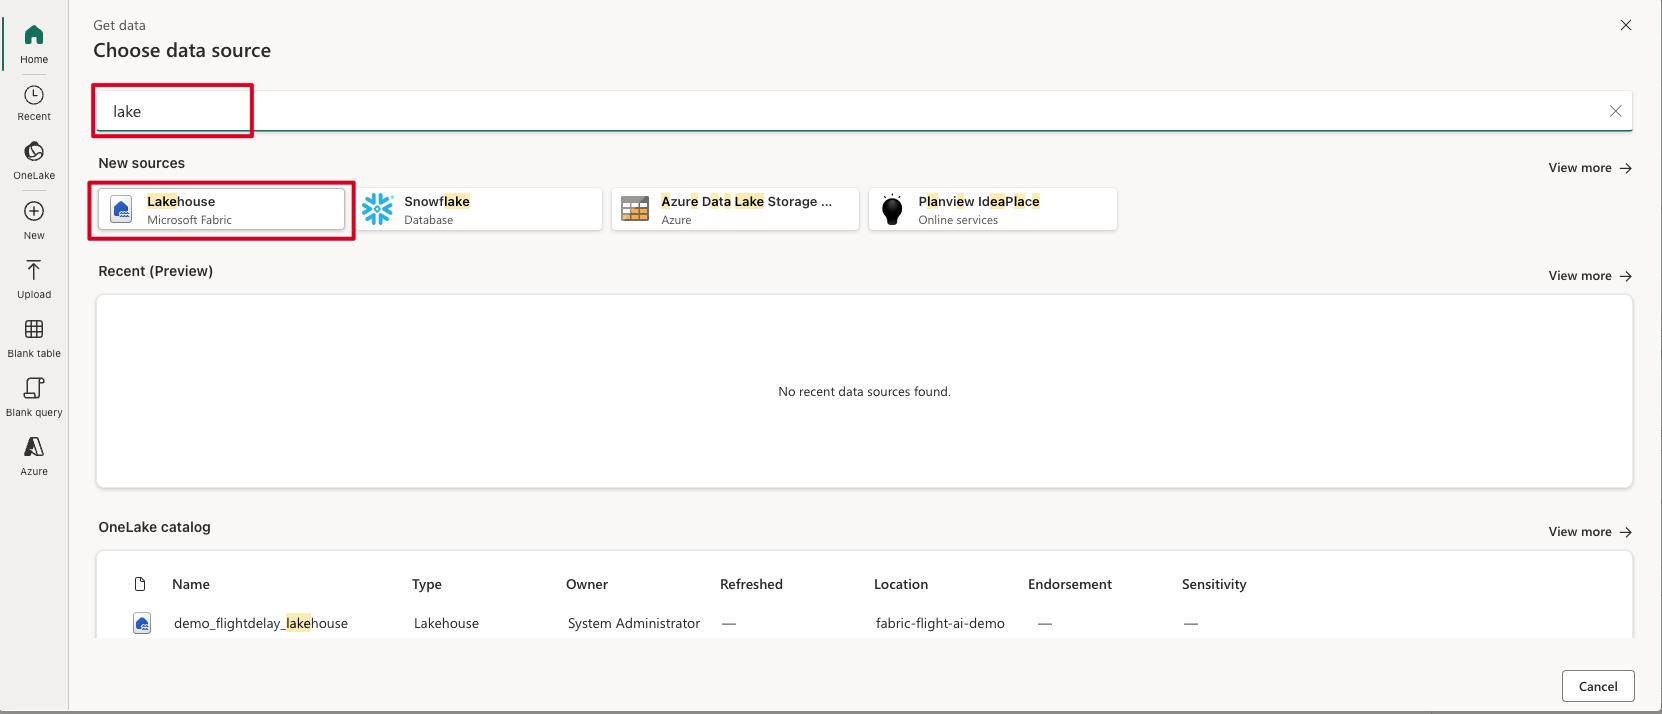
- In Dataflow Gen2, click Get data
- Select Lakehouse from data sources
Step 2: Create Connection to Lakehouse
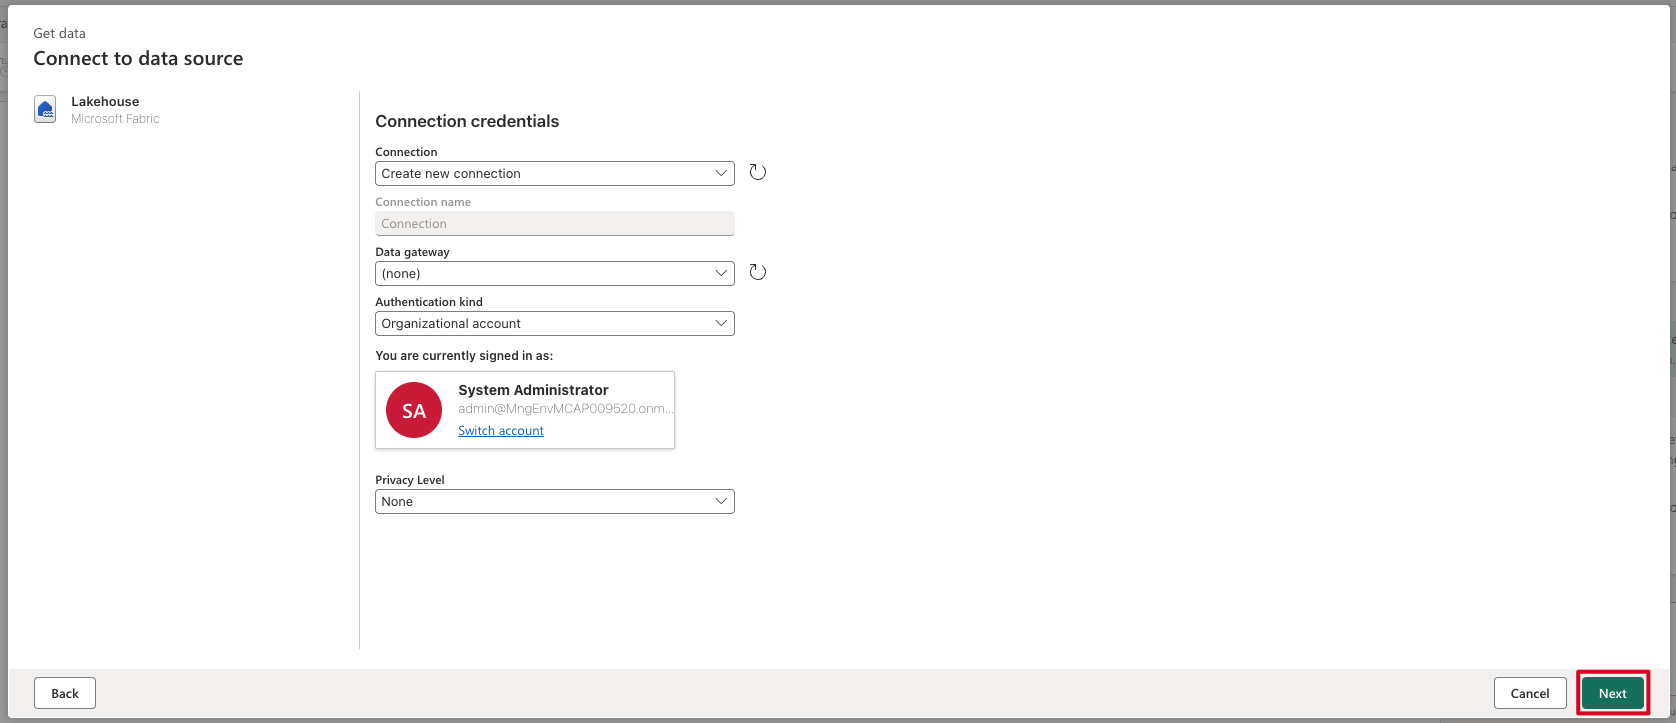
- Create new connection to your lakehouse
- Select your workspace and lakehouse
Step 3: Choose the CSV File
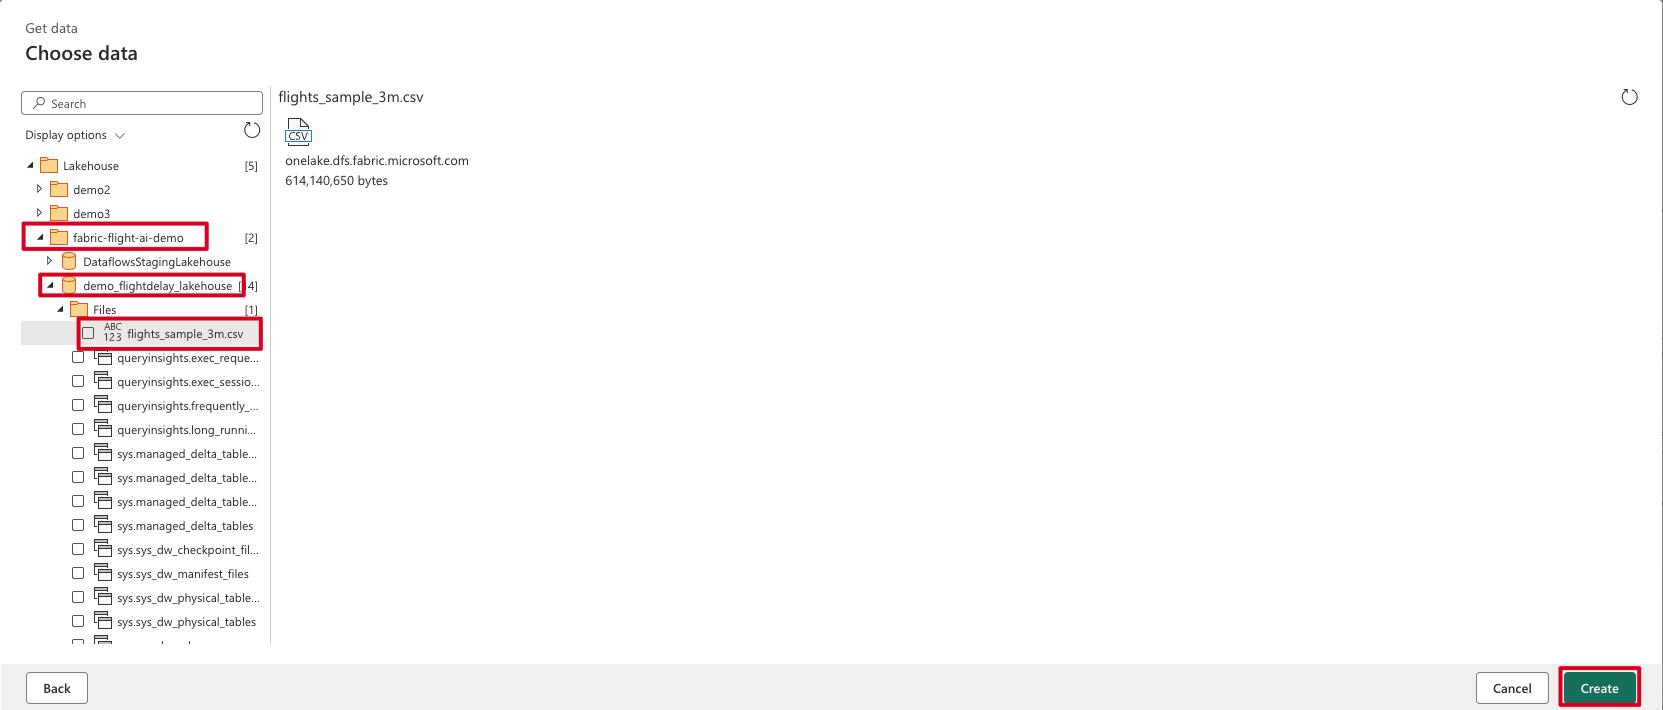
- Navigate to Files folder in your lakehouse
- Select
flights_sample_3m.csv - Click Create to add the data source
Load the CSV file from Lakehouse named `flights_sample_3m.csv`
- Remove null ARR_DELAY rows:
This step demonstrates how Copilot can be used to clean data before analysis — it is an example of what’s possible when preparing datasets for ML workflows in Fabric.
Remove all rows where the value in the column `ARR_DELAY` is null.
- Create column
IS_DELAYED:
Create a new column `IS_DELAYED`.
Set its value to 1 if `ARR_DELAY` > 15, otherwise 0.
- Create column
DEP_HOUR:
Create a column `DEP_HOUR` by extracting hour from `CRS_DEP_TIME` (e.g. 1530 → 15).
- Create column
FL_DAYOFWEEK:
Extract day of the week from `FL_DATE` and store in `FL_DAYOFWEEK`. Monday = 1.
- Create column
FL_MONTH:
Extract month from `FL_DATE` and store in `FL_MONTH`. Use Date.Month([FL_DATE]).
Save Output:
- Destination: Warehouse
The Warehouse is chosen for storing processed data to facilitate efficient data retrieval and seamless integration with Power BI for analytics and reporting purposes.
- Table name:
flightdelay-features - Click Run and Save
Step 3: Data Agent
Create Data Agent:
Step 1: Create New Data Agent
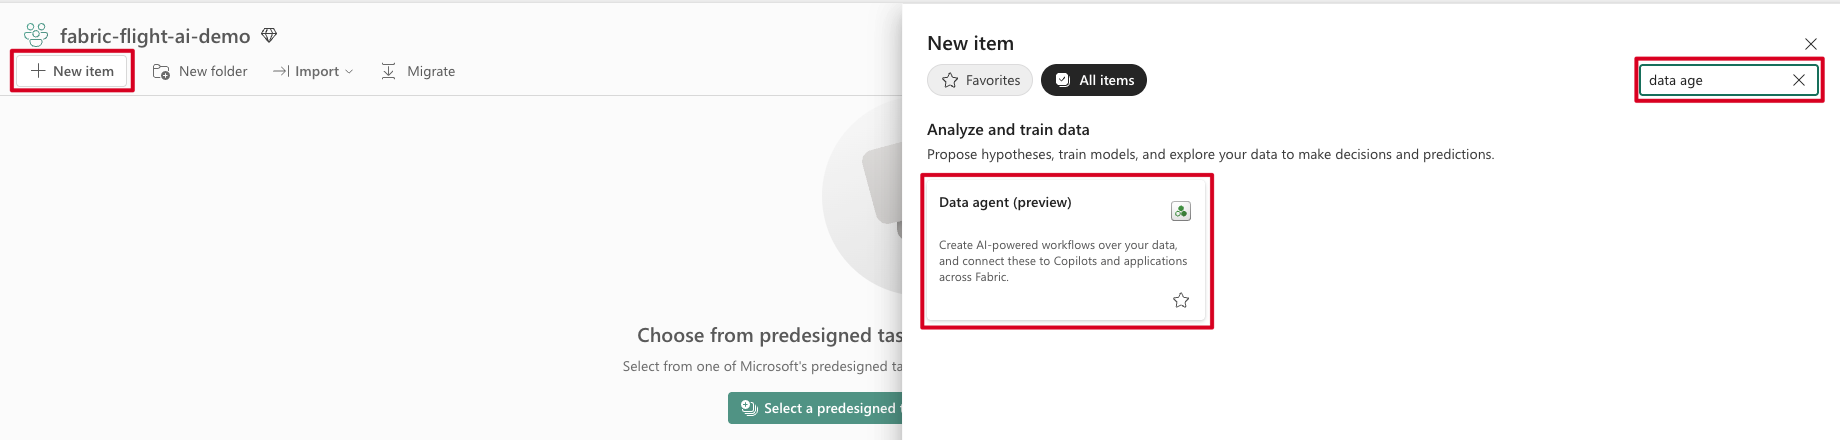
- Go to workspace > + New item
- Search for “data age” and select Data agent (preview)
Step 2: Define the Name for Data Agent
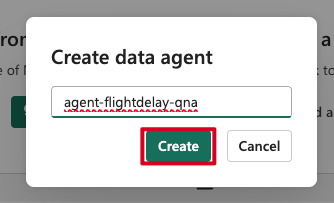
- Name it:
agent-flightdelay-qna - Click Create
Step 3: Connect Data Agent to Lakehouse
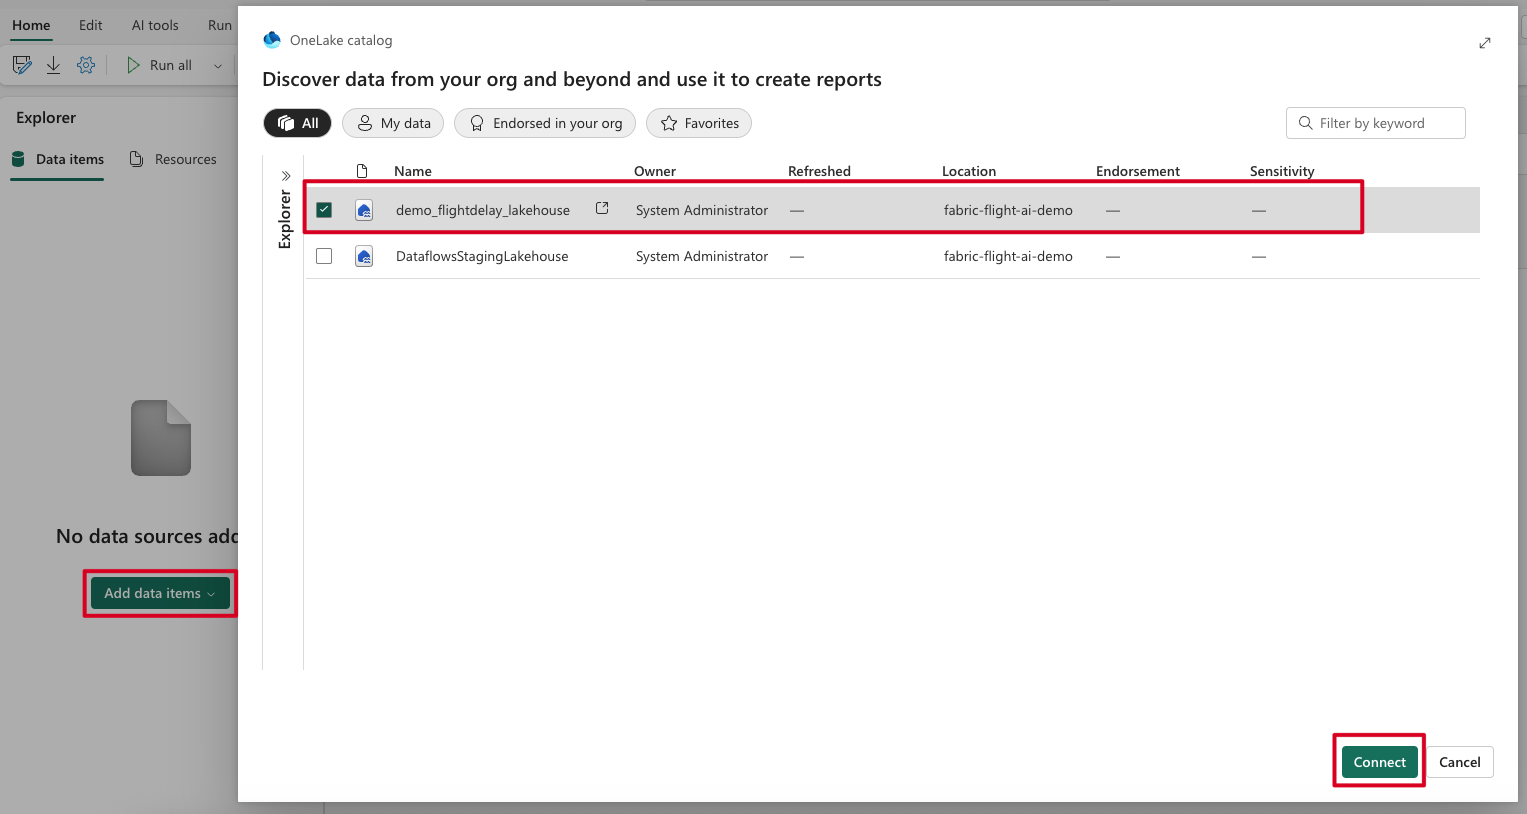
- Click Add data items
- Select the demo_flightdelay_lakehouse from OneLake catalog
- Click Connect
Step 4: Enable the Table for Data Agent
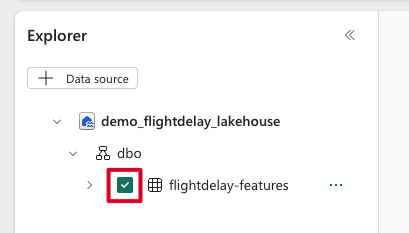
- In the Explorer, expand demo_flightdelay_lakehouse > dbo
- Check the flightdelay-features table to enable it
- This allows the Data Agent to access the table data
Example Queries to Try:
Simple Queries:
What percentage of flights were delayed?Which hour of the day has the highest number of delays?How often do flights get delayed on each day of the week?Show me the top 5 airports with the most delays.Which airlines have the highest average arrival delay?What is the monthly trend of delayed flights?
More Complex Queries:
Compare delay rates between weekdays and weekends.Are longer flights more likely to be delayed?What is the most common reason for delays among delayed flights?
Example Response from Data Agent:
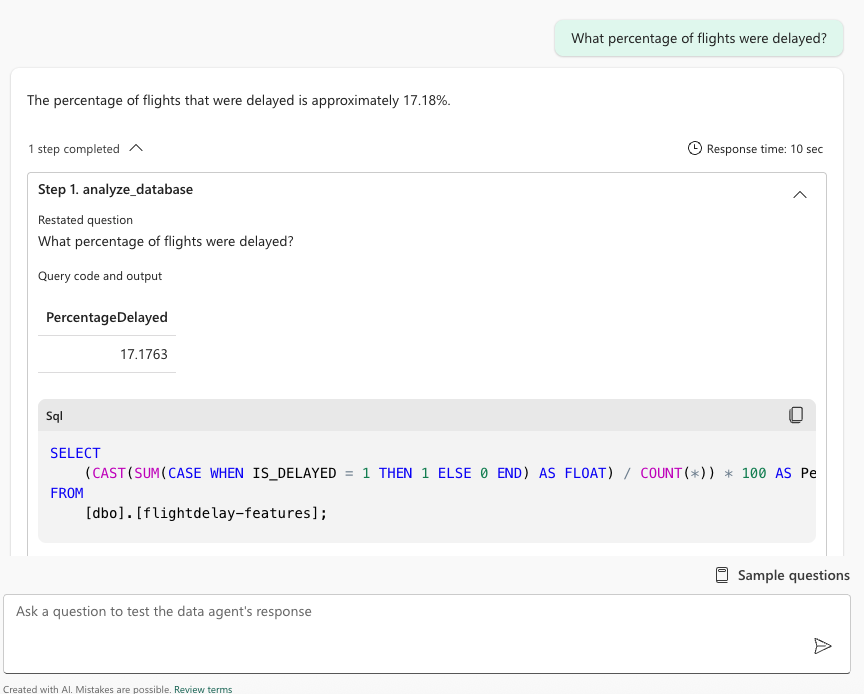
The Data Agent can answer natural language questions about your flight data and provides:
- Clear answers in plain language (e.g., “17.18% of flights were delayed”)
- SQL query that was generated and executed
- Tabular results showing the actual data
- Response time for performance monitoring
This demonstrates how the Data Agent translates business questions into SQL queries and returns actionable insights from your flight delay dataset.
Step 4: Notebooks – AI Modeling
Create Notebook:
- Go to + New > Notebook
- Name it:
nb-flightdelay-model
Prompt 1 – Load and Prepare Data
Load the `flightdelay-features` table into a Spark DataFrame.
Prepare the data for binary classification on `IS_DELAYED`.
Apply cleaning and encoding automatically.
Prompt 2 – Train Model
Train a binary classification model to predict `IS_DELAYED`.
Split into train/test sets, fit the model, and evaluate its performance.
Prompt 3 – Visualize Results
During this step, you will discover which features most influence flight delays. For example, in the test scenario, the hour of departure (DEP_HOUR) had the strongest predictive power — flights later in the day are generally more prone to delays. In contrast, features like distance or specific origin/destination airports had much less influence.
This helps demonstrate how machine learning can uncover non-obvious patterns in flight data and guide operational improvements or forecasting strategies.
Show feature importance (bar chart), a confusion matrix (heatmap), and delay rate by `DEP_HOUR` (line chart).
Prompt 4 – Predict New Flight
Create a DataFrame with a flight:
- DEP_HOUR = 18
- FL_DAYOFWEEK = 5
- FL_MONTH = 12
- AIRLINE_CODE = "UA"
- ORIGIN = "ORD"
- DEST = "LGA"
- DISTANCE = 733

Apply preprocessing, predict `IS_DELAYED`, and print:
- Class (0 or 1)
- Probability
- Message ("likely to be delayed" or not)
- Confidence %
Step 5: Power BI – Dashboard
Create Semantic Model:
- From the Warehouse table
flightdelay-features, create a semantic model - Name it:
sm_flightdelay_prediction
The semantic model provides a structured layer over your data to simplify building Power BI reports. It helps streamline data access, organize fields for analysis, and enable self-service reporting experiences.
- Use Direct Lake for optimal performance
Auto-Create Report:
Step 1: Access Auto-Create Report Option
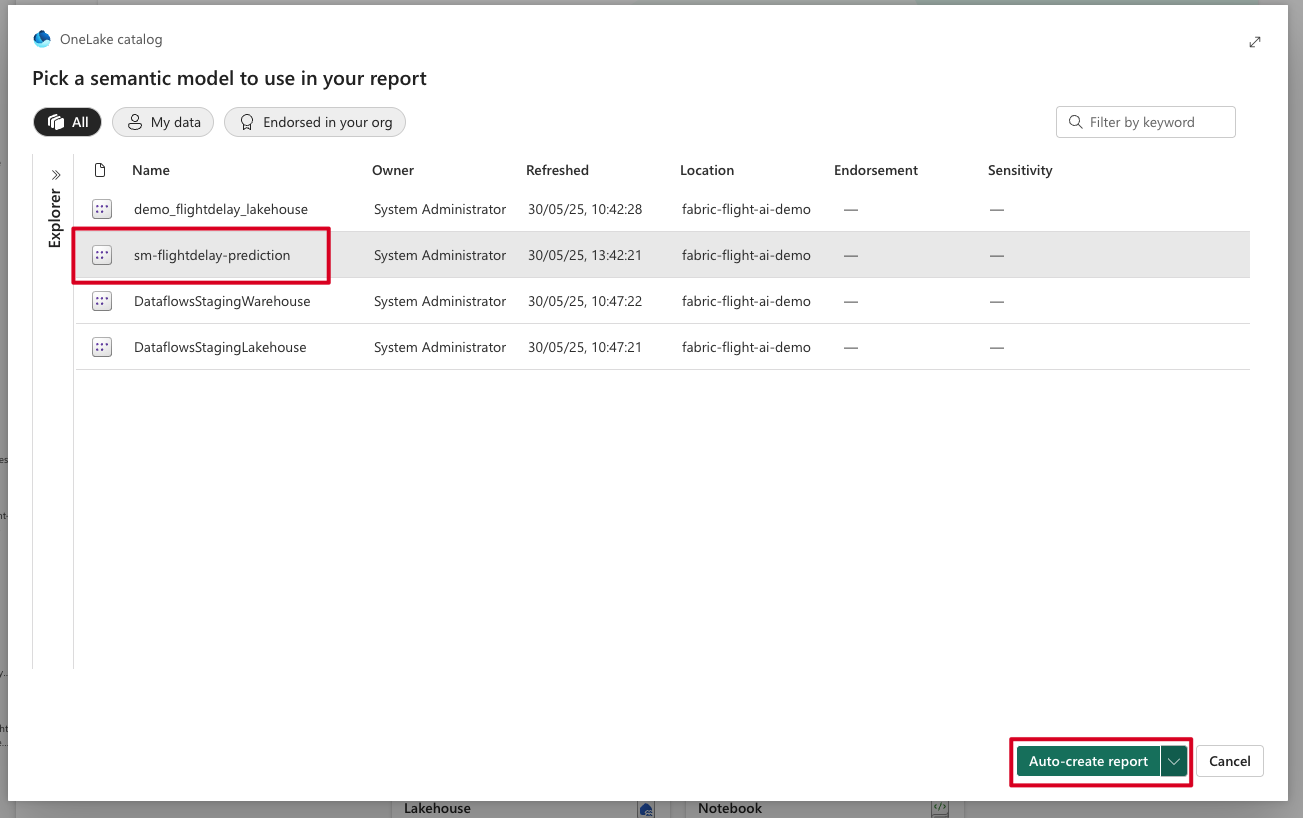
- In the Fabric workspace, locate the Power BI semantic model
sm_flightdelay_prediction - Click on the More menu (…) next to the model
- Select Auto-create report — this automatically generates a suggested Power BI report with visuals based on your data model
Step 2: Review Generated Report
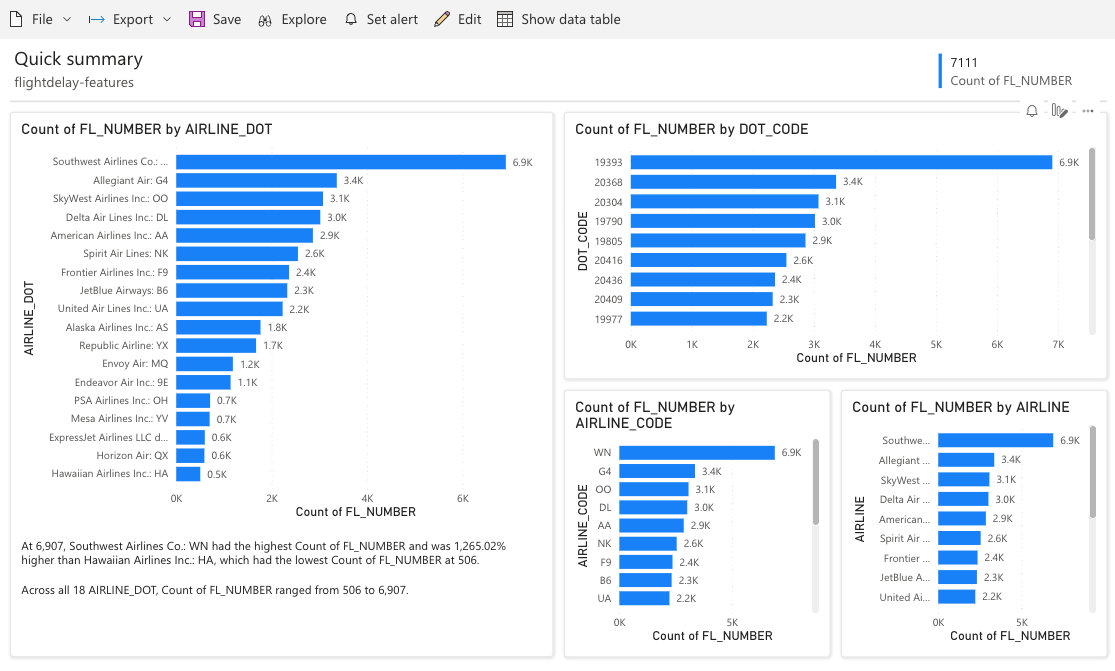
- The system automatically creates visualizations based on your data
- You can edit the layout or keep the default structure
- Click Save — your report will be saved in the same workspace if you have write access, or in My Workspace otherwise
What you can learn from this lab
- How to clean and enrich flight data using Dataflow Gen2 and Copilot.
- How to build a binary classification model using Copilot in Notebooks.
- How to identify the most important factors influencing flight delays. For example, in this scenario, departure hour (
DEP_HOUR) had the strongest impact on delays, while other features like distance or route have minimal influence. - How to ask natural language questions to your dataset using Data Agent.
- How to auto-generate a Power BI report in one click using a semantic model.
All these steps can be conducted without writing a single line of code — this lab shows how you can use Copilot to streamline your analytical work and boost productivity.
This lab showcases how Microsoft Fabric Copilot helps reduce friction across the full data-to-insight workflow.
🛠️ To-do
Notebook & Automation:
- Use the Notebook Public API to trigger this lab notebook programmatically as a REST endpoint.
Semantic Model:
- Use Copilot during semantic model creation to generate meaningful field names, relationships, and descriptions. Learn more
Power BI Copilot:
- Extend the Power BI Copilot experience using features described here, such as:
- Generating summary text in natural language.
- Automatically suggesting new visuals based on your questions.
- Using smart narrative to describe patterns or anomalies.
- Building new pages with AI-driven insights.
Power BI MCP (Model Context Protocol):
- Integrate AI assistants with Power BI semantic models using the Remote MCP Server to enable natural language queries against your data models.
- Explore the Power BI Modeling MCP GitHub repository for tools and examples on connecting AI agents to Power BI.
I will be happy to hear your feedback or answer any questions. You can contact me via LinkedIn: aka.ms/taras.